
Reading Your Blood Sugar Numbers: A Reference Guide to Ranges and What They Signal

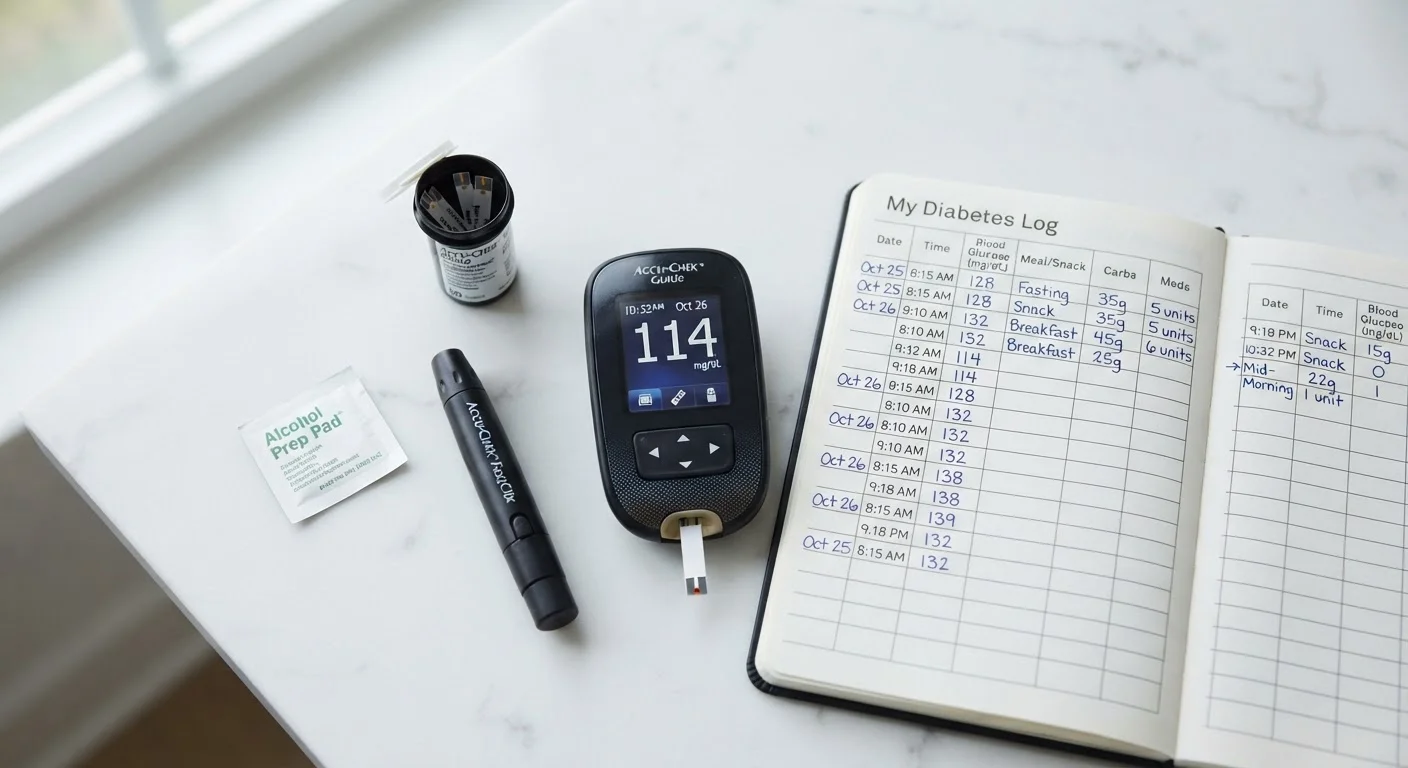
| Normal fasting glucose | Below 100 mg/dL (American Diabetes Association Standards of Care) |
| Prediabetes fasting range | 100 to 125 mg/dL (American Diabetes Association Standards of Care) |
| Diabetes fasting threshold | 126 mg/dL or higher (confirmed on two tests) (American Diabetes Association Standards of Care) |
| Normal HbA1c | Below 5.7% (American Diabetes Association Standards of Care) |
| Prediabetes HbA1c range | 5.7% to 6.4% (American Diabetes Association Standards of Care) |
| Diabetes HbA1c threshold | 6.5% or higher (confirmed on two tests) (American Diabetes Association Standards of Care) |
| Normal 2-hour postprandial glucose | Below 140 mg/dL (American Diabetes Association Standards of Care) |
| HbA1c time window | Reflects approximately 2 to 3 months of average glucose |
The three main blood sugar tests and what they measure
Blood sugar monitoring relies on three distinct measurements, each capturing a different window of glucose activity. Knowing what each one measures helps you read lab results accurately and ask better questions of your healthcare provider.
Fasting plasma glucose (FPG) measures blood glucose after at least 8 hours without eating. It reflects the liver's baseline glucose output and the body's ability to regulate sugar overnight. This is the most common screening test for prediabetes and diabetes.
Postprandial glucose (sometimes called a 2-hour glucose test) measures blood sugar two hours after a meal or a standardized glucose drink during an oral glucose tolerance test (OGTT). It shows how efficiently the body clears a glucose load. For more on why that spike occurs and what shapes its height, see why blood sugar spikes after a meal.
Hemoglobin A1c (HbA1c) is a percentage that reflects average blood glucose over approximately 2 to 3 months. Red blood cells carry hemoglobin, and glucose binds to it over the cell's lifespan. A higher percentage means higher average glucose exposure. It does not replace daily monitoring but gives clinicians a longer-term picture.
| Normal fasting glucose | Below 100 mg/dL (American Diabetes Association Standards of Care) |
| Prediabetes fasting range | 100 to 125 mg/dL (American Diabetes Association Standards of Care) |
| Diabetes fasting threshold | 126 mg/dL or higher (confirmed on two tests) (American Diabetes Association Standards of Care) |
| Normal HbA1c | Below 5.7% (American Diabetes Association Standards of Care) |
| Prediabetes HbA1c range | 5.7% to 6.4% (American Diabetes Association Standards of Care) |
| Diabetes HbA1c threshold | 6.5% or higher (confirmed on two tests) (American Diabetes Association Standards of Care) |
| Normal 2-hour postprandial glucose | Below 140 mg/dL (American Diabetes Association Standards of Care) |
| HbA1c time window | Reflects approximately 2 to 3 months of average glucose |
Clinical reference ranges explained
The American Diabetes Association (ADA) publishes diagnostic thresholds that clinicians use to classify glucose status. These ranges apply to non-pregnant adults unless otherwise noted.
Fasting plasma glucose
- Normal: below 100 mg/dL
- Prediabetes (impaired fasting glucose): 100 to 125 mg/dL
- Diabetes: 126 mg/dL or higher on two separate tests
Two-hour postprandial glucose (OGTT)
- Normal: below 140 mg/dL
- Prediabetes (impaired glucose tolerance): 140 to 199 mg/dL
- Diabetes: 200 mg/dL or higher
HbA1c
- Normal: below 5.7%
- Prediabetes: 5.7% to 6.4%
- Diabetes: 6.5% or higher on two separate tests
A single elevated result is rarely sufficient for a diabetes diagnosis (except in the presence of symptoms such as extreme thirst or unexplained weight loss). Clinicians typically confirm with a repeat test or a second method. For a clear breakdown of how prediabetes and diabetes differ in cause and progression, see Type 1, Type 2, and prediabetes compared.
Fasting plasma glucose (FPG)
A blood glucose measurement taken after at least 8 hours without eating or drinking anything other than water. It reflects the body's baseline glucose level and the liver's overnight glucose output.
HbA1c (hemoglobin A1c)
A lab value expressed as a percentage that estimates average blood glucose over approximately 2 to 3 months. It measures how much glucose has bound to hemoglobin in red blood cells.
Postprandial glucose
Blood glucose measured after eating. Clinicians often use a 2-hour postprandial value to assess how effectively the body clears glucose following a meal or standardized glucose drink.
Oral glucose tolerance test (OGTT)
A diagnostic test in which a person drinks a standardized glucose solution and has blood drawn at set intervals, typically at the 2-hour mark, to assess how the body processes glucose.
Impaired fasting glucose
A fasting plasma glucose reading between 100 and 125 mg/dL, indicating a prediabetic state where glucose regulation is compromised but has not yet reached the diabetes threshold.
Impaired glucose tolerance
A 2-hour postprandial glucose reading between 140 and 199 mg/dL during an OGTT, indicating the body is slower than normal at clearing a glucose load. It is another marker of prediabetes.
What the numbers signal beyond a diagnosis
Clinical thresholds mark categories, but the numbers carry information beyond a simple pass or fail. A fasting glucose of 98 mg/dL and one of 124 mg/dL both fall in the "normal" or "prediabetes" range, yet they suggest different levels of metabolic stress and urgency for lifestyle review.
HbA1c is especially worth understanding in context. Certain conditions, including hemolytic anemia, iron deficiency, and some hemoglobin variants, can distort HbA1c readings without reflecting true average glucose. A clinician who knows your complete blood count can interpret whether the A1c result is reliable for you.
Postprandial readings tell a different story than fasting values. Some people maintain normal fasting glucose while showing impaired glucose tolerance after meals, a pattern that can be missed without an OGTT. This is one reason why how the body regulates glucose between meals matters as much as a single snapshot number.
Blood glucose is also one marker within a broader metabolic picture. Insulin sensitivity, inflammatory markers, and cardiovascular risk factors all interact with glucose status. The full metabolic health picture connects these threads. For readers new to the topic, a plain-language introduction to blood sugar covers the foundational concepts.
This article provides general health information for educational purposes only and is not a substitute for professional medical advice, diagnosis, or treatment. Always consult a qualified healthcare provider with questions about your blood sugar results or any medical condition.